
 Multi-currency support
Leveraged ETFs
Cryptocurrencies
UK Gilts
UK CGT reporting
Equalisation payments
List of shortcut keys
Notes on data storage
Multi-currency support
Leveraged ETFs
Cryptocurrencies
UK Gilts
UK CGT reporting
Equalisation payments
List of shortcut keys
Notes on data storage
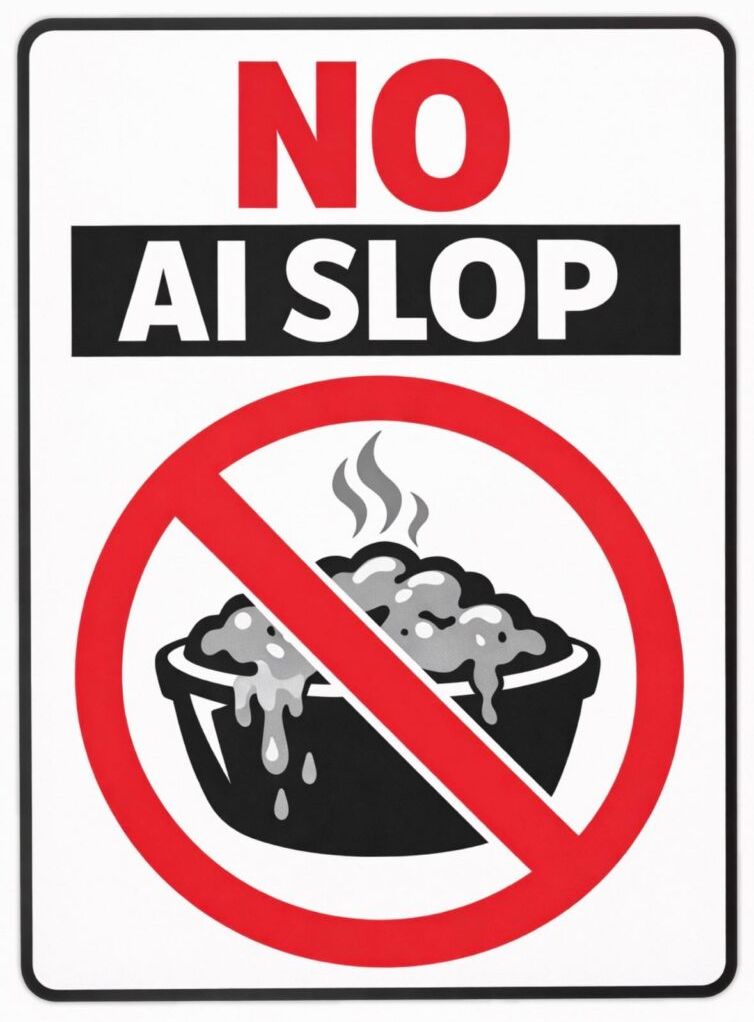
Portfolio Inspector was hand-written by humans (me, specifically) with minimal AI input. For the moment, at least, I believe that nothing beats good old-fashioned human craftsmanship !

Feedback
I'd love to hear your feedback about Portfolio Inspector. Did you find a bug, or does something about the app annoy you ? Is there a must-have feature that I missed ? Please let me know ! I won't include the address as plaintext to minimise spam, but send your emails to :

Thank you !

-- Chris F (author)
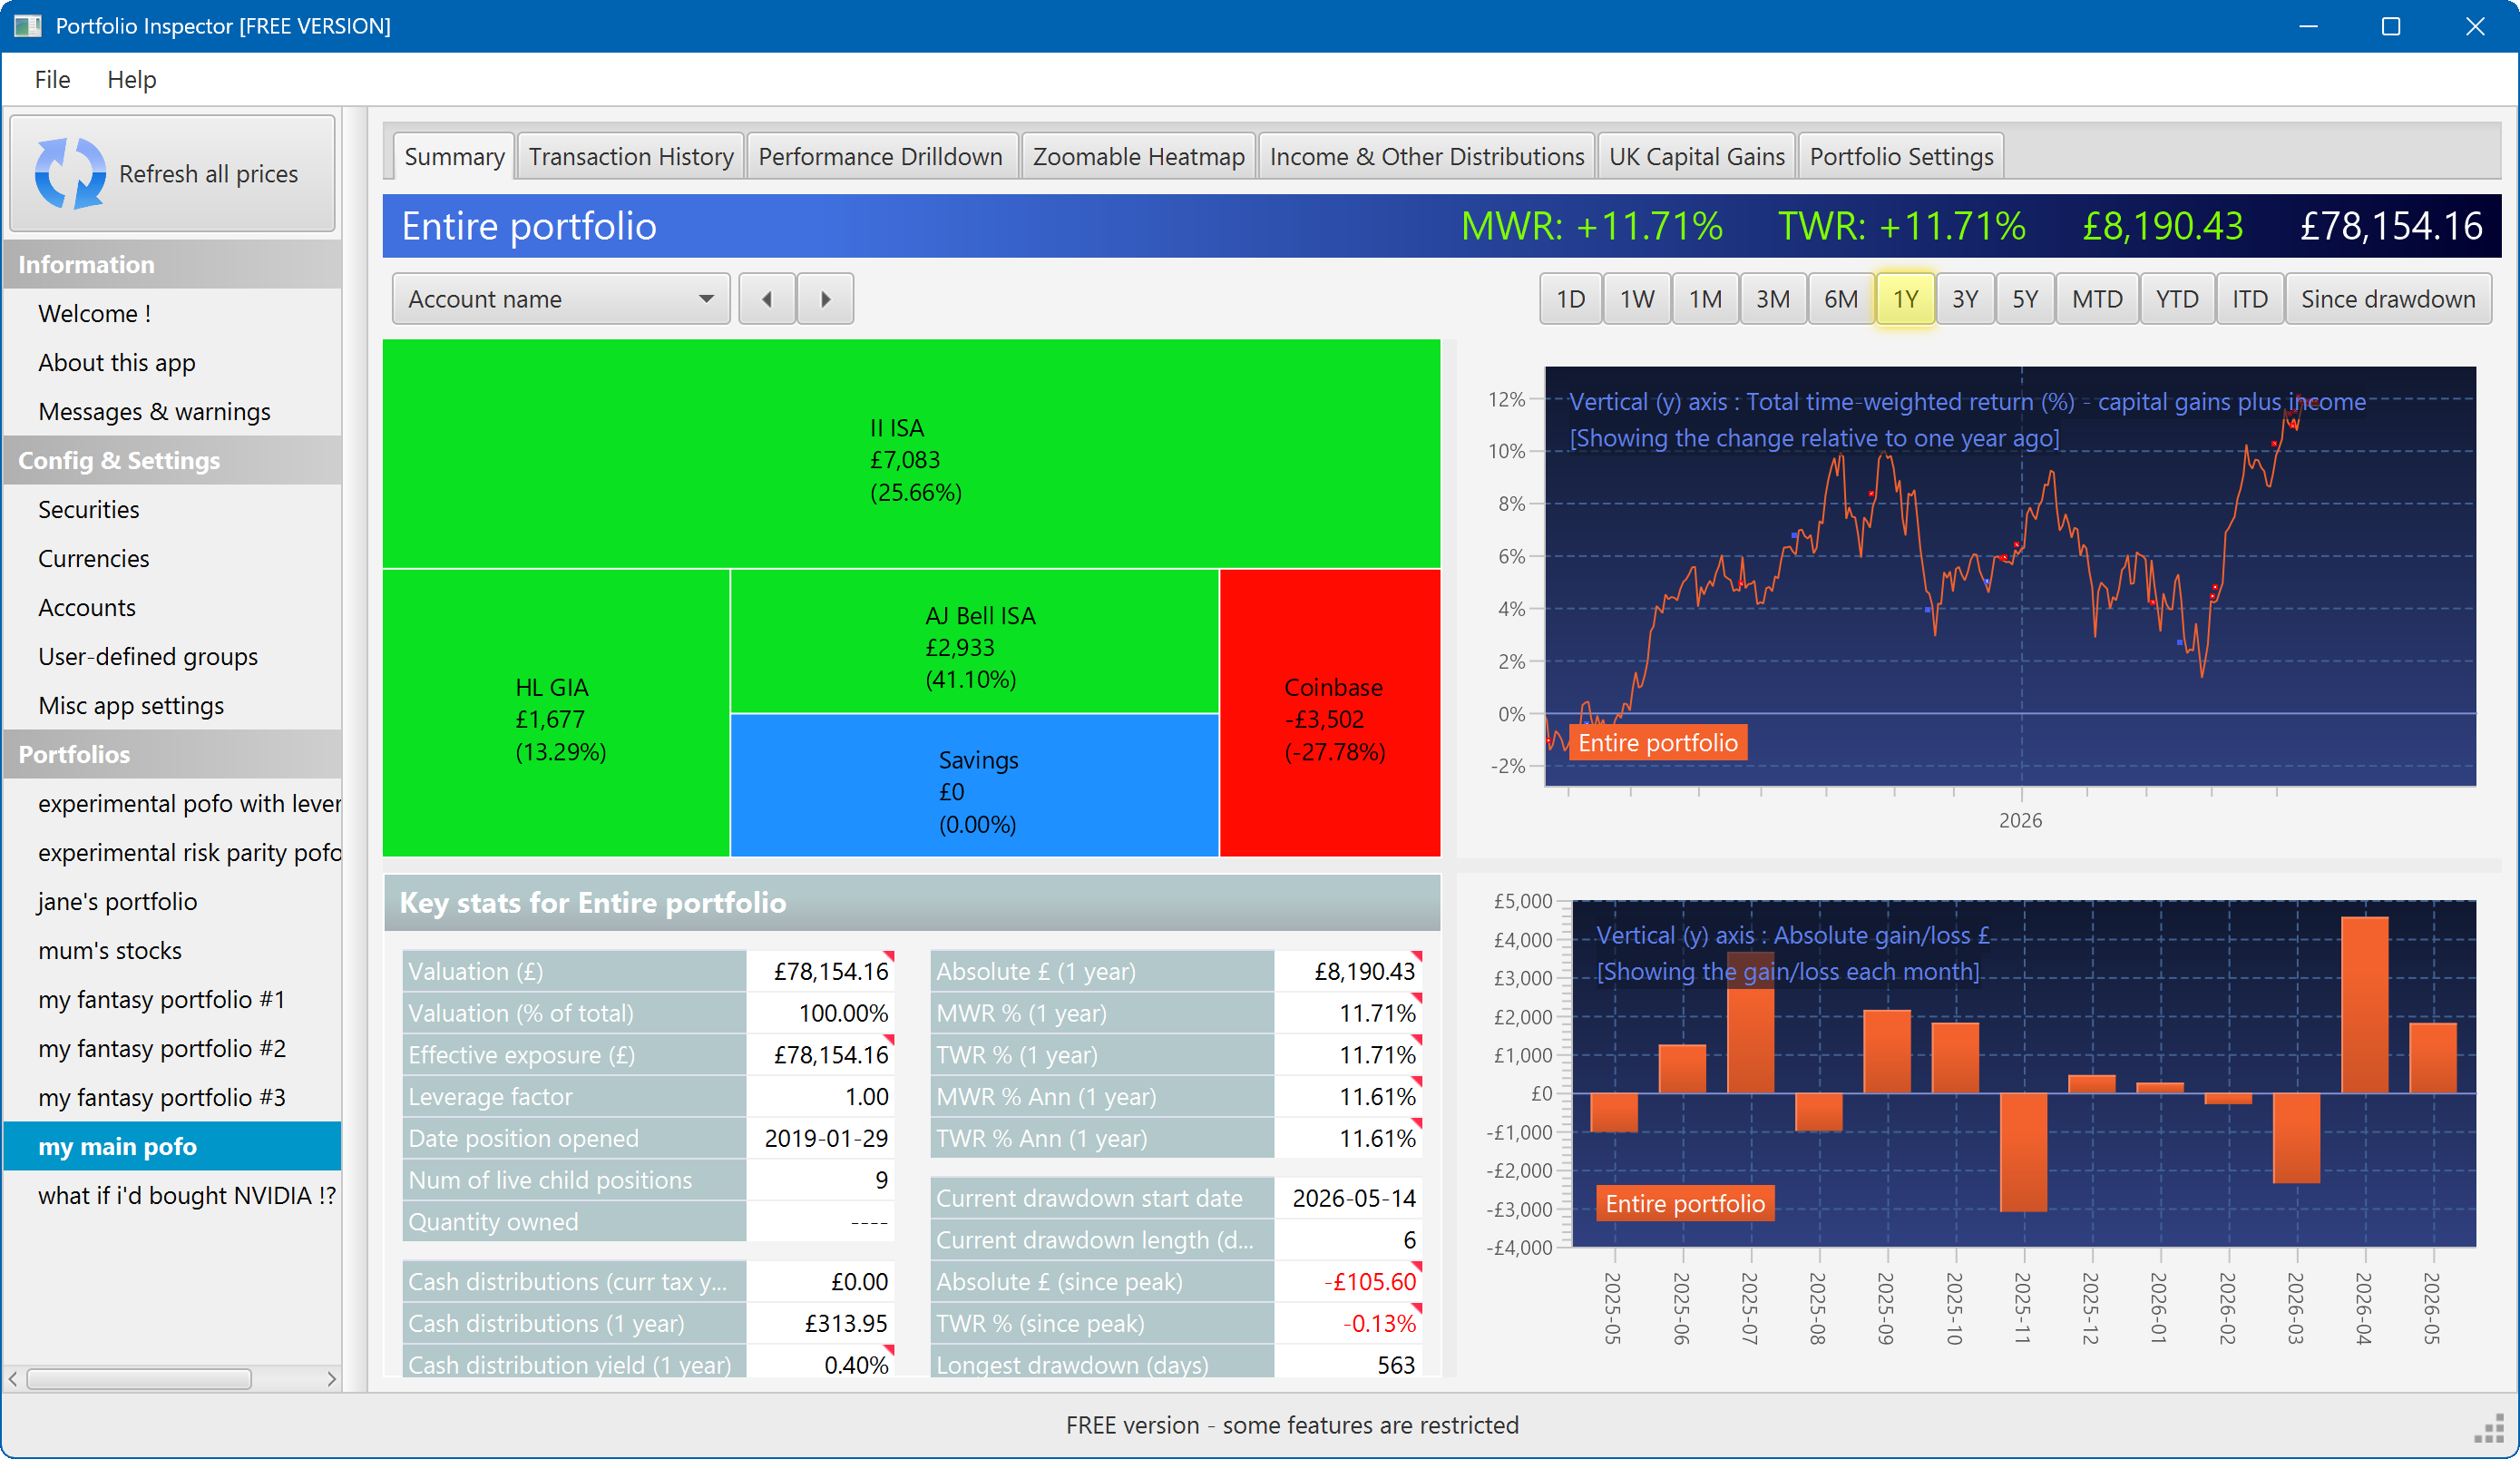
The summary screen gives an at-a-glance overview of your portfolio's performance. To read more about it, click here
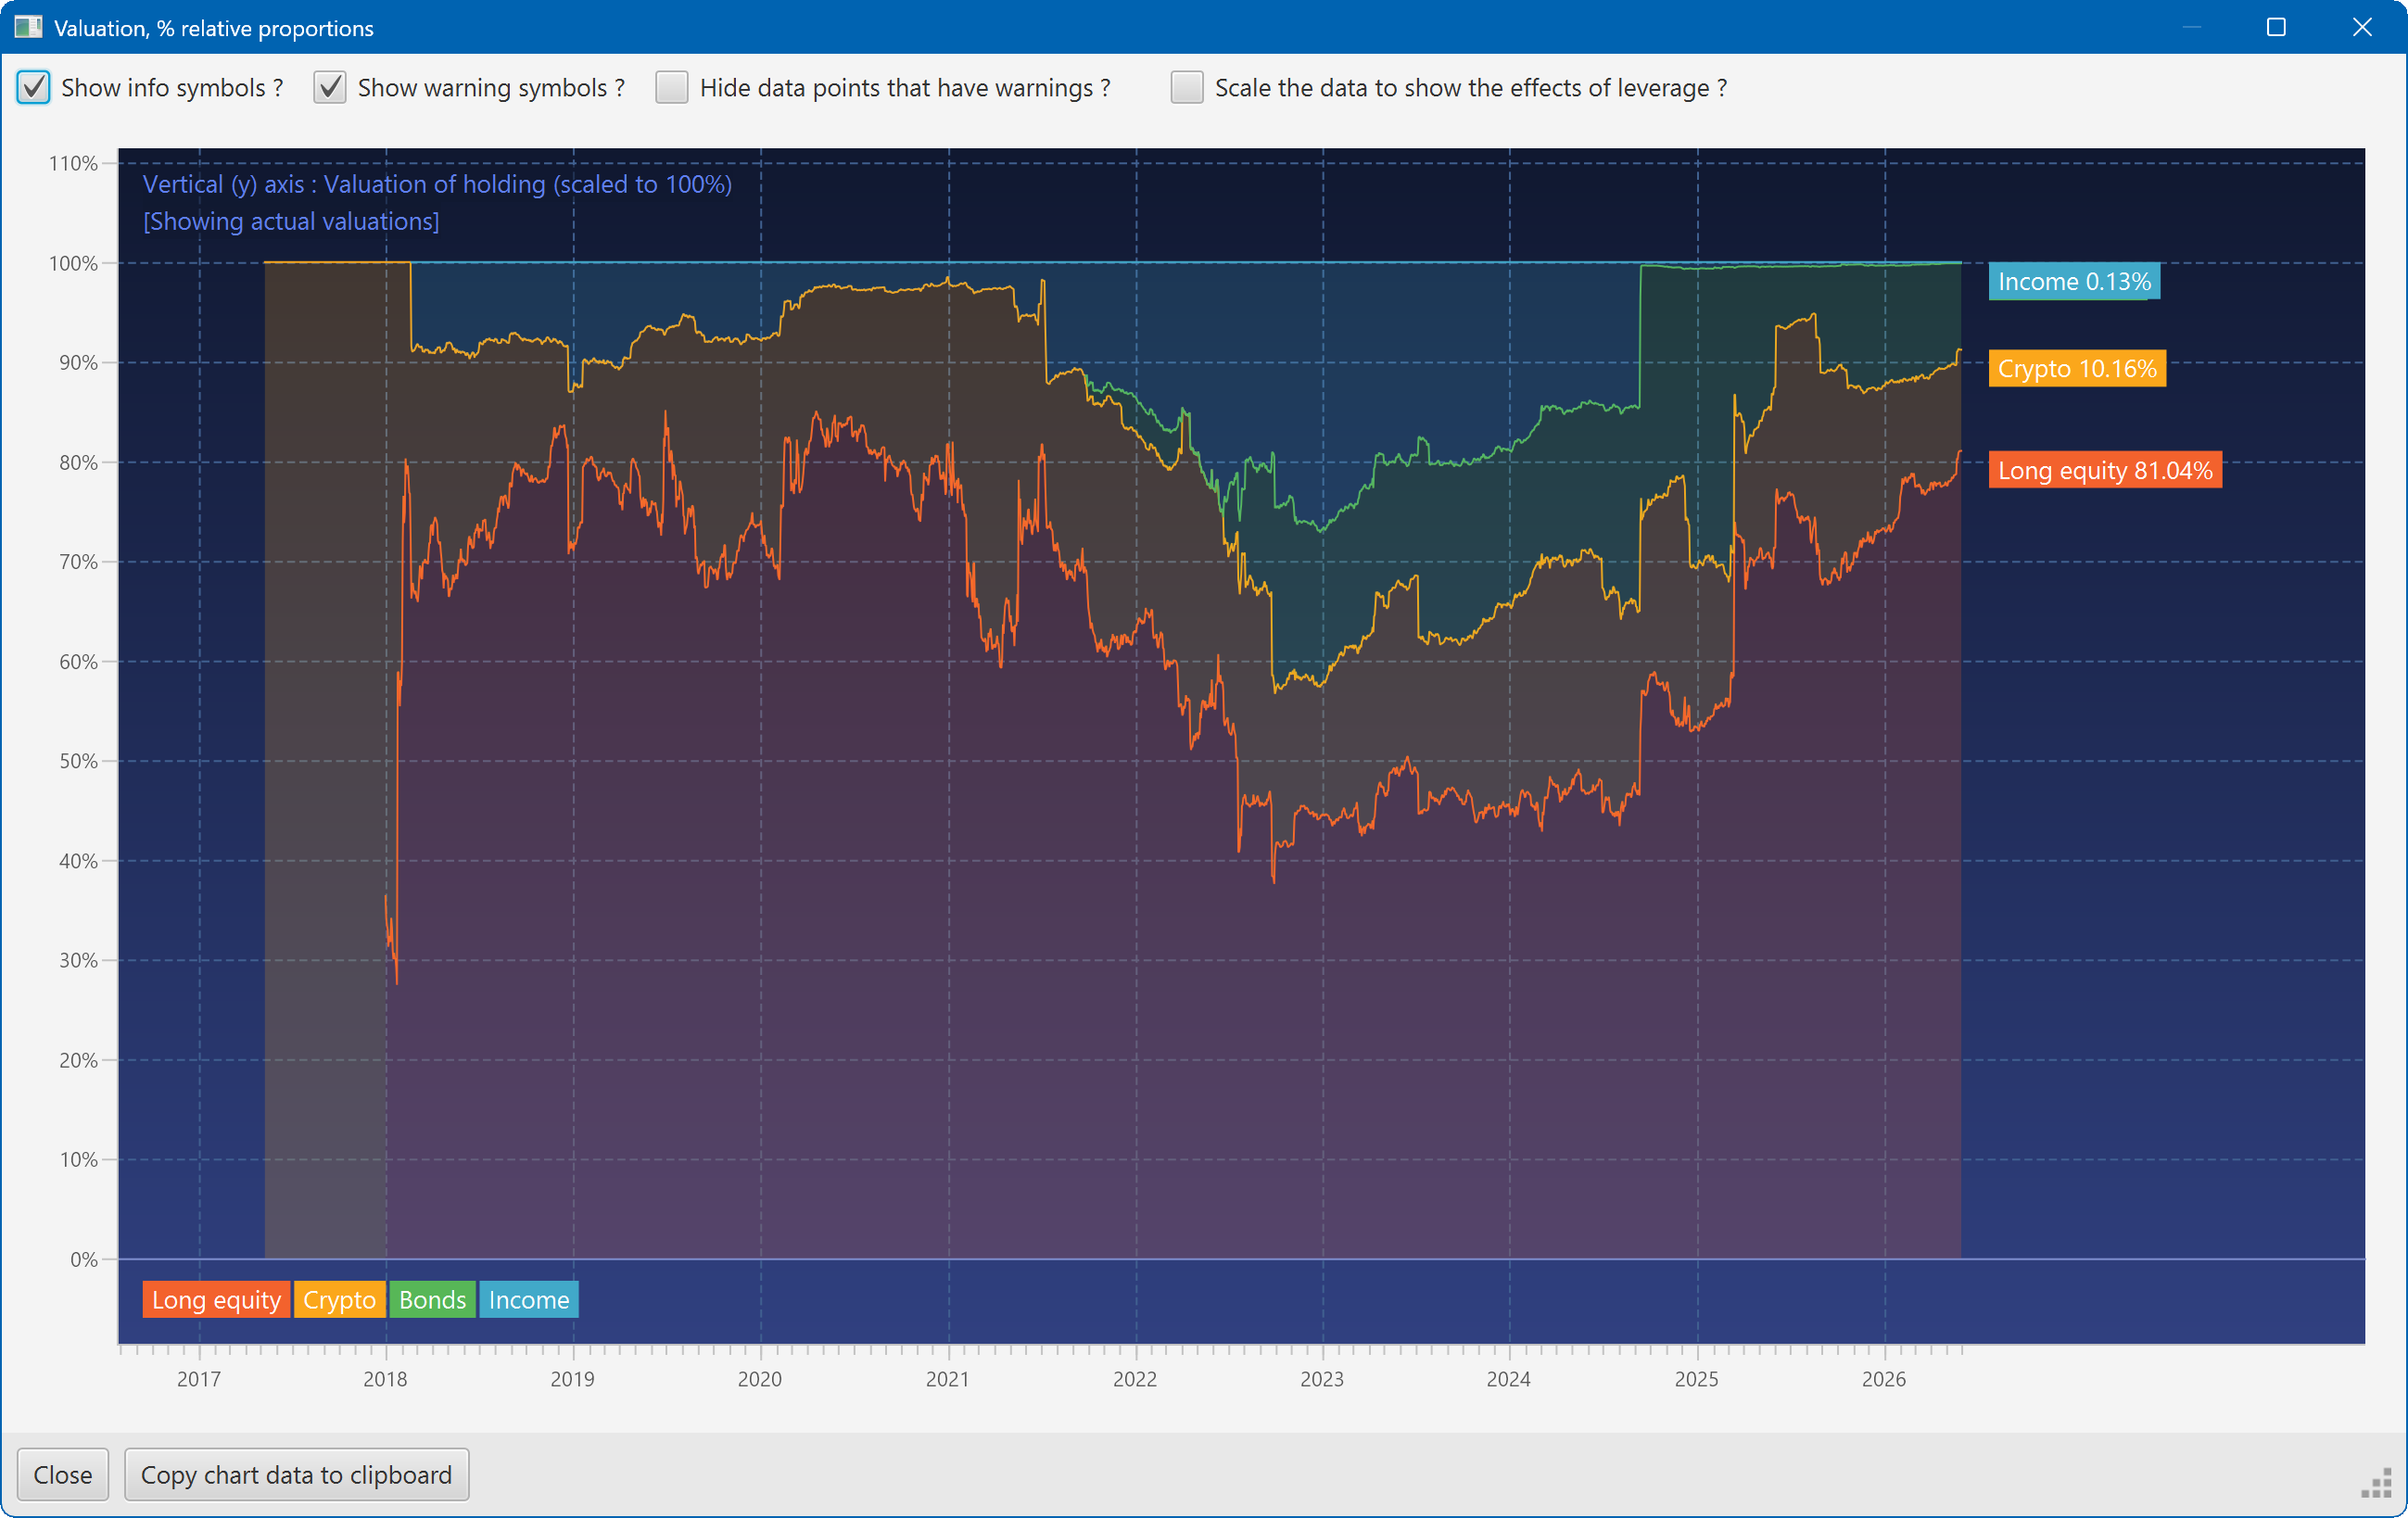
This plot shows the changing composition of a portfolio over time. It uses user-defined groups to organise the assets into different classes.
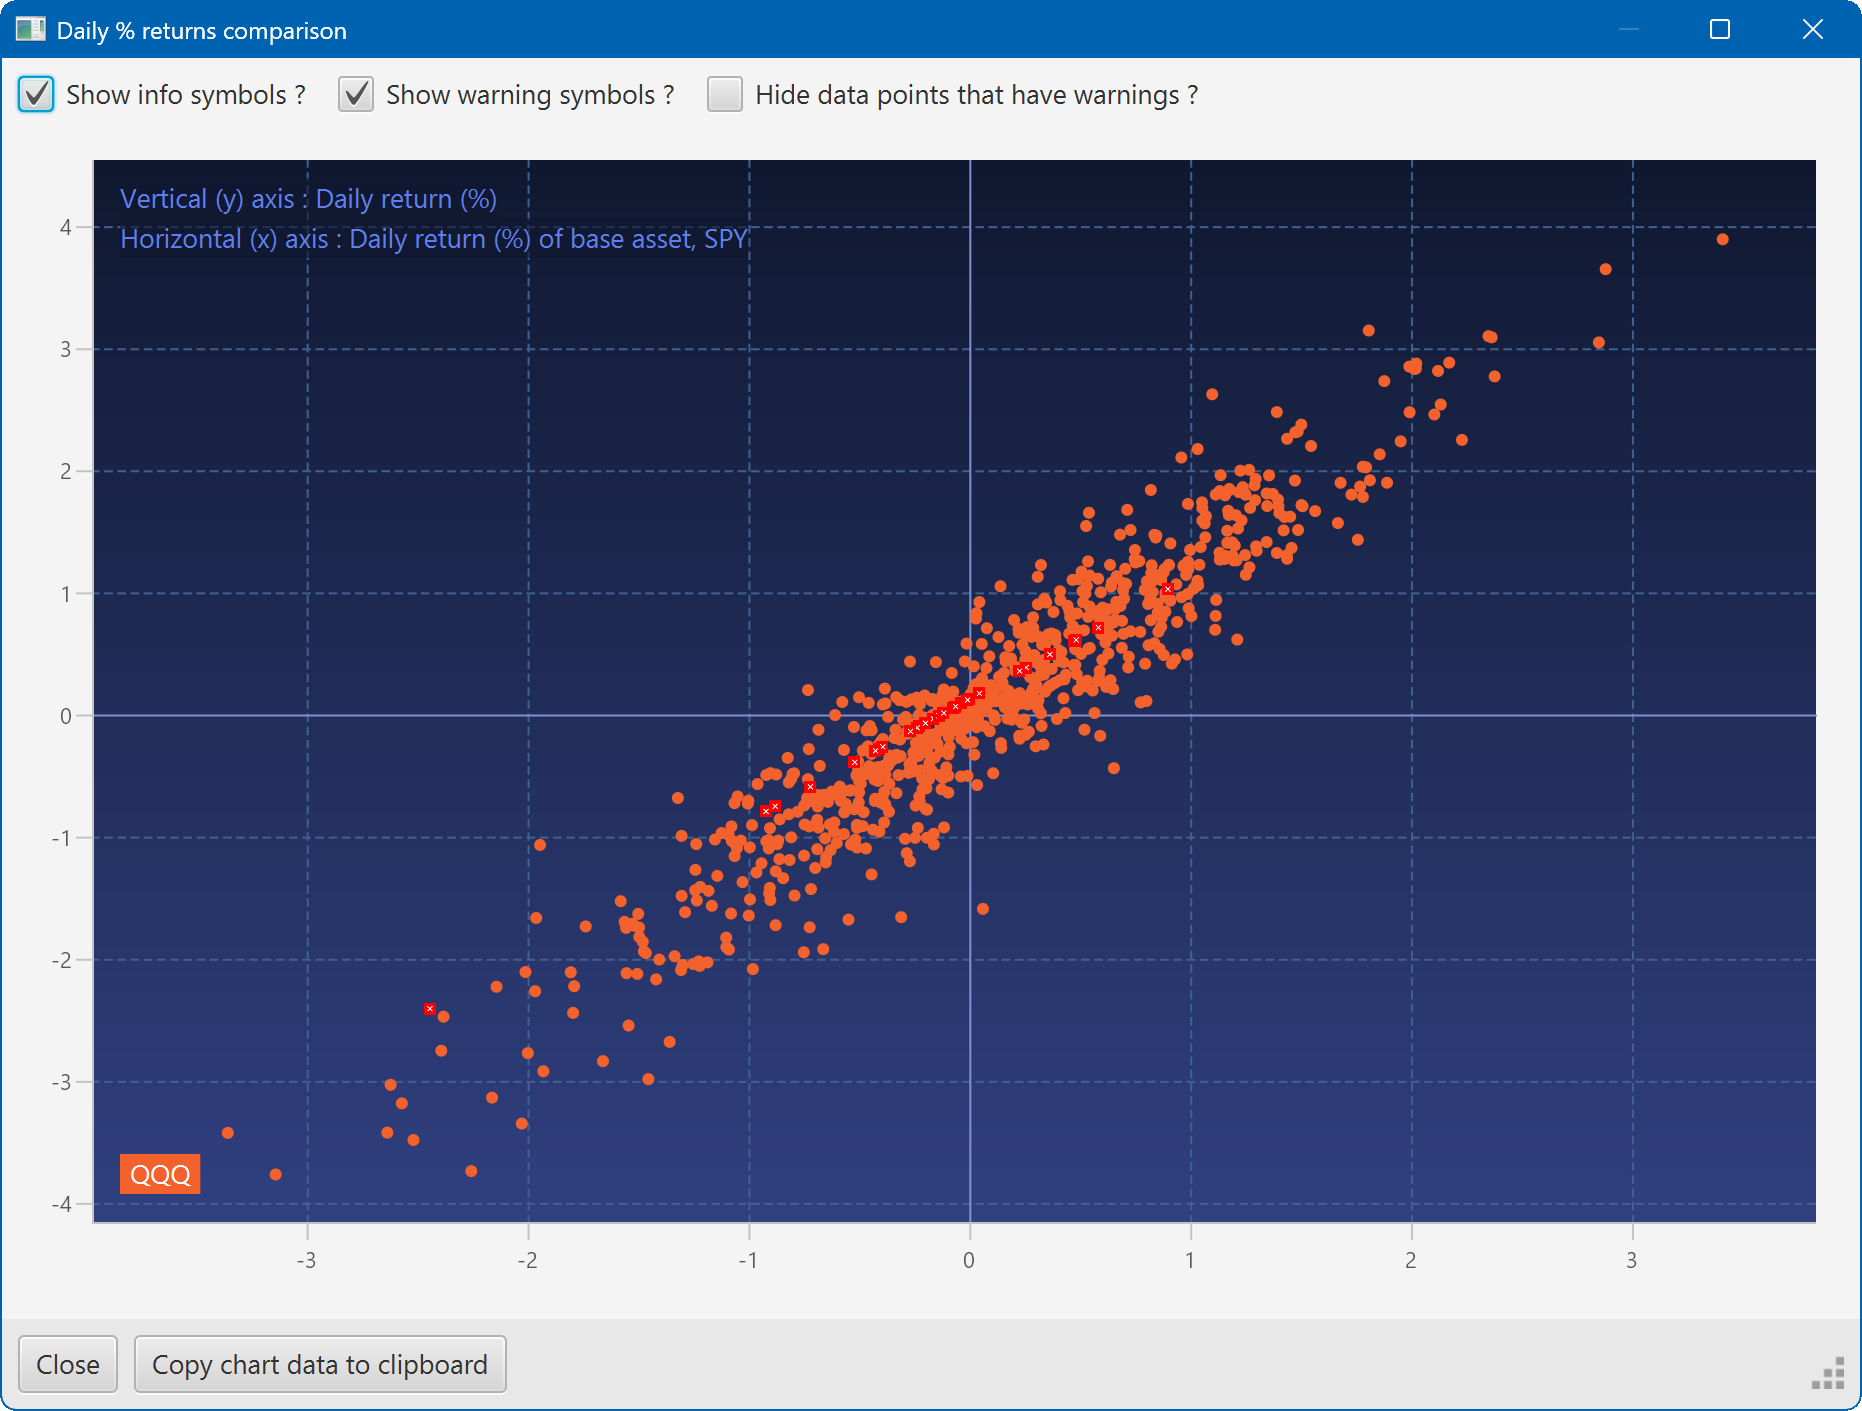
A scatter plot, showing how the daily moves of one security (QQQ) relate to the daily moves of another (SPY)
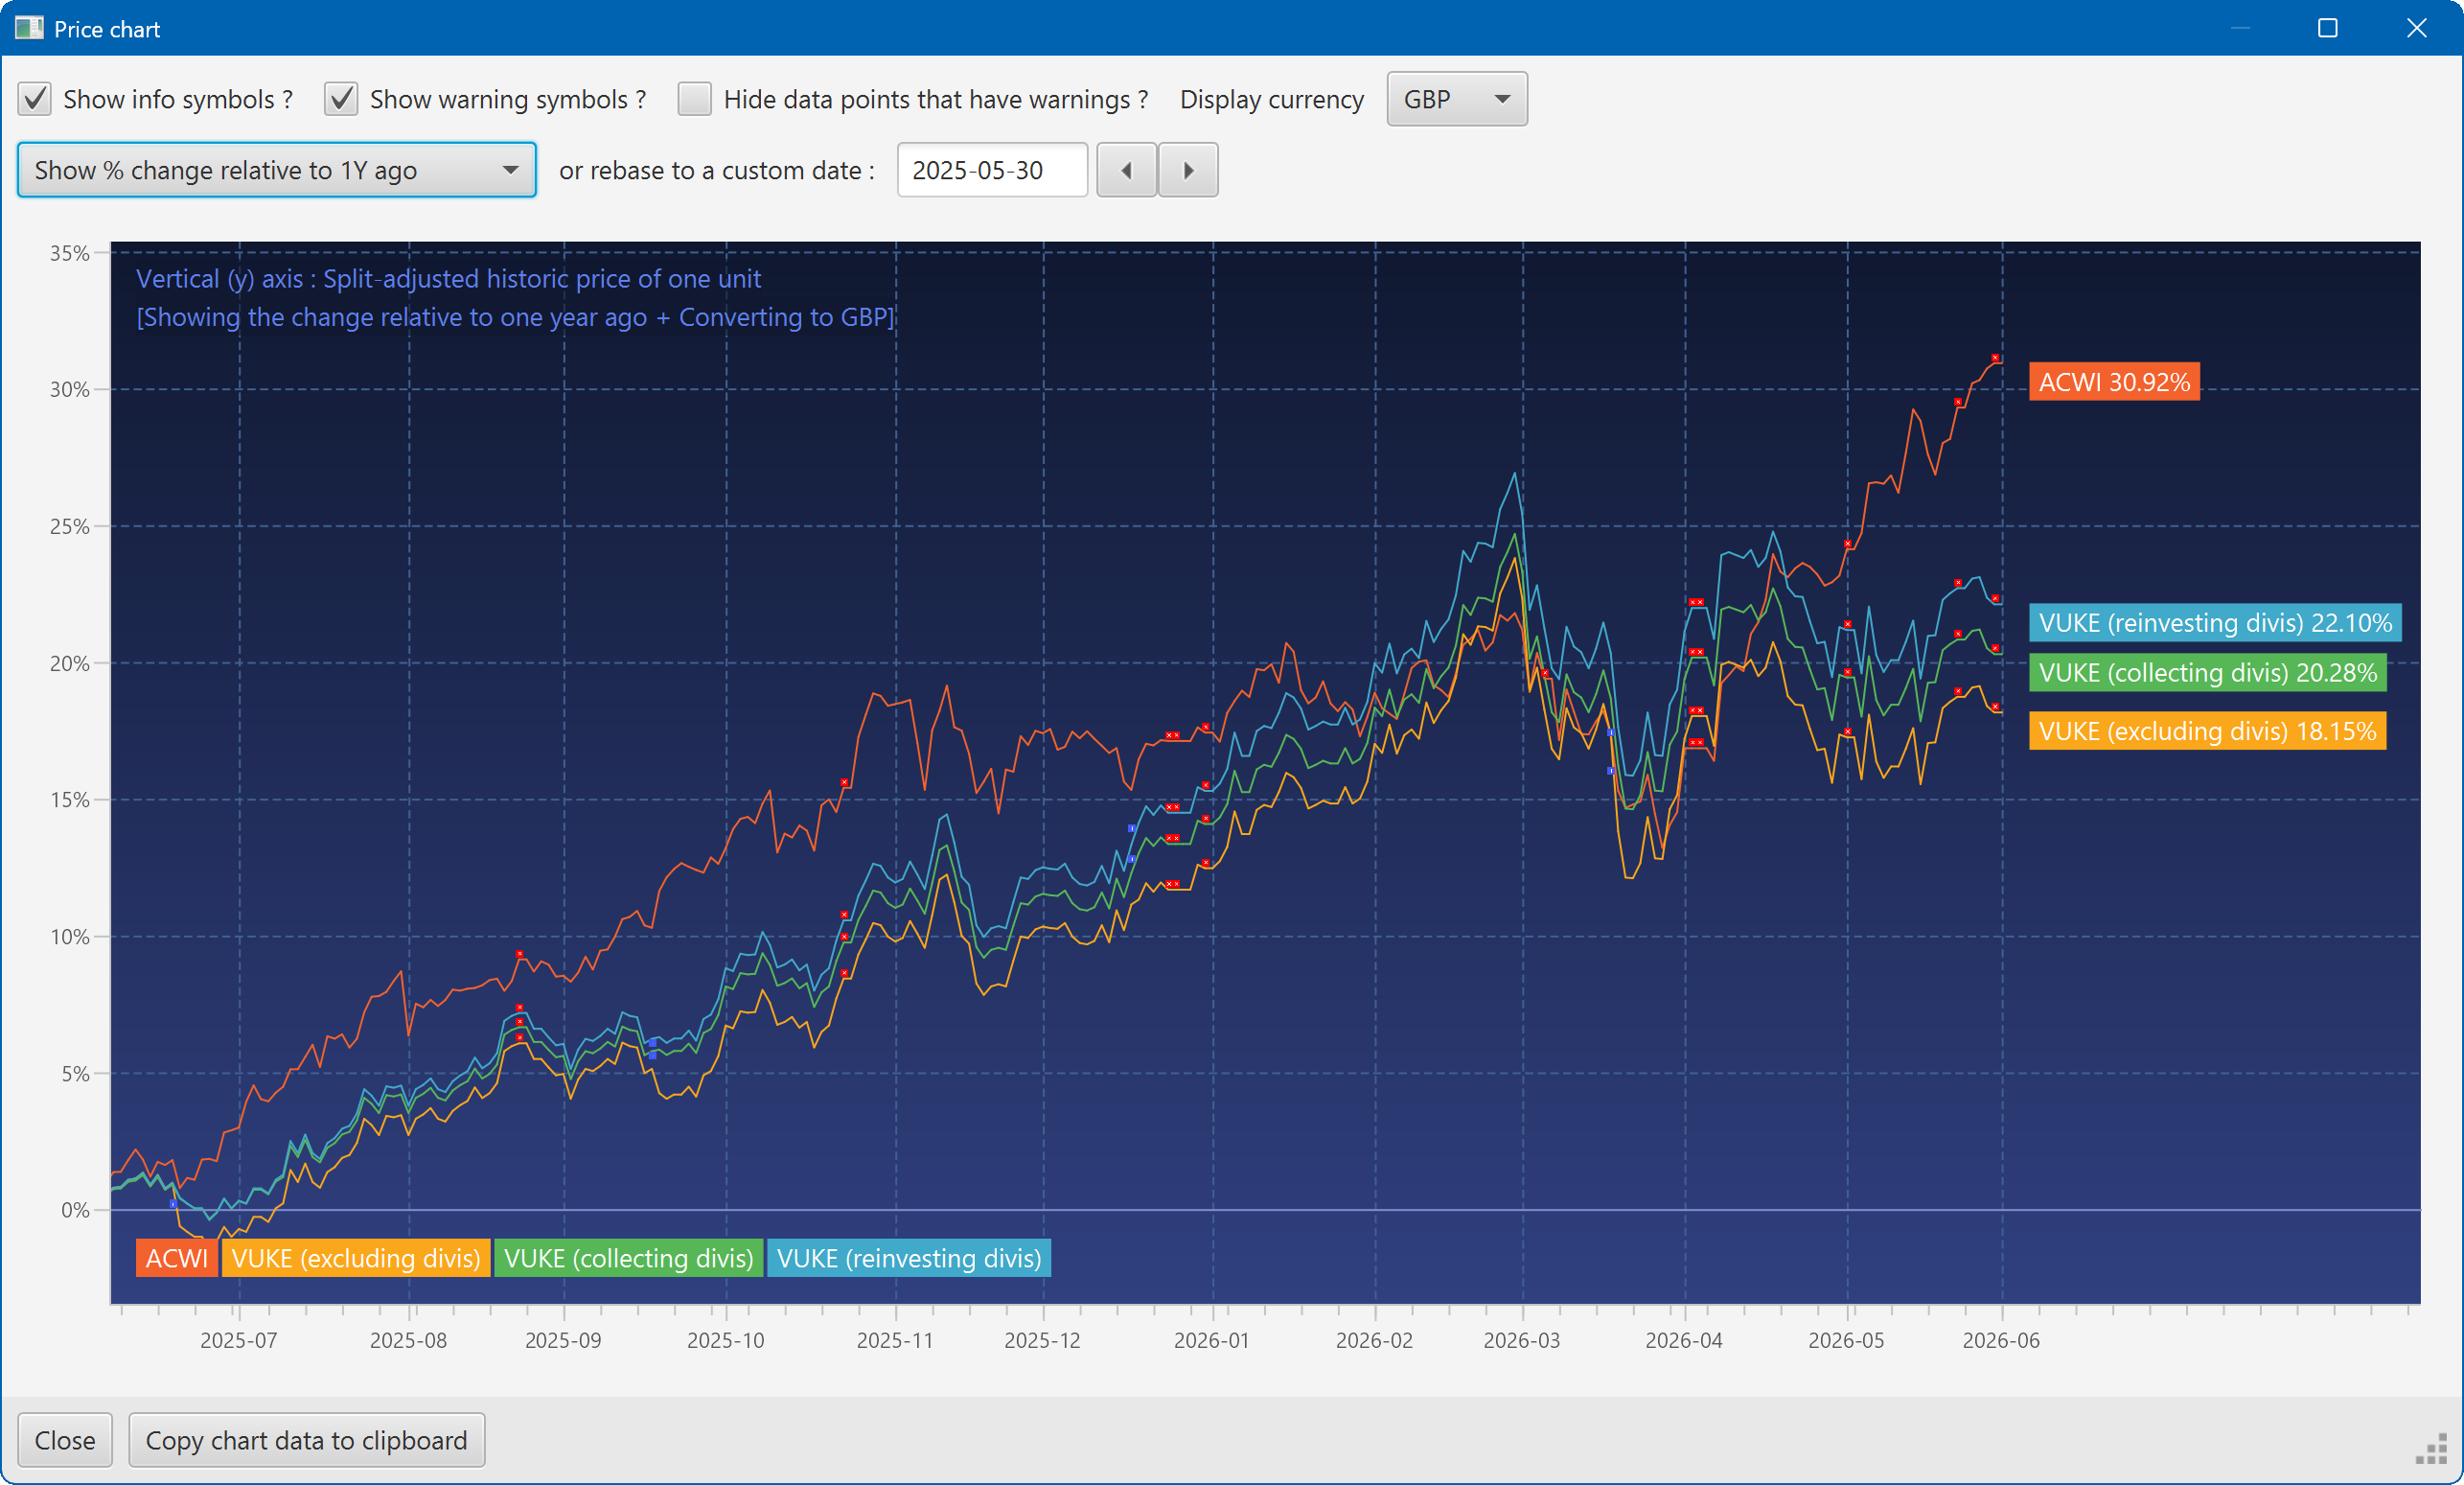
A chart showing the growth of two securities over the past year
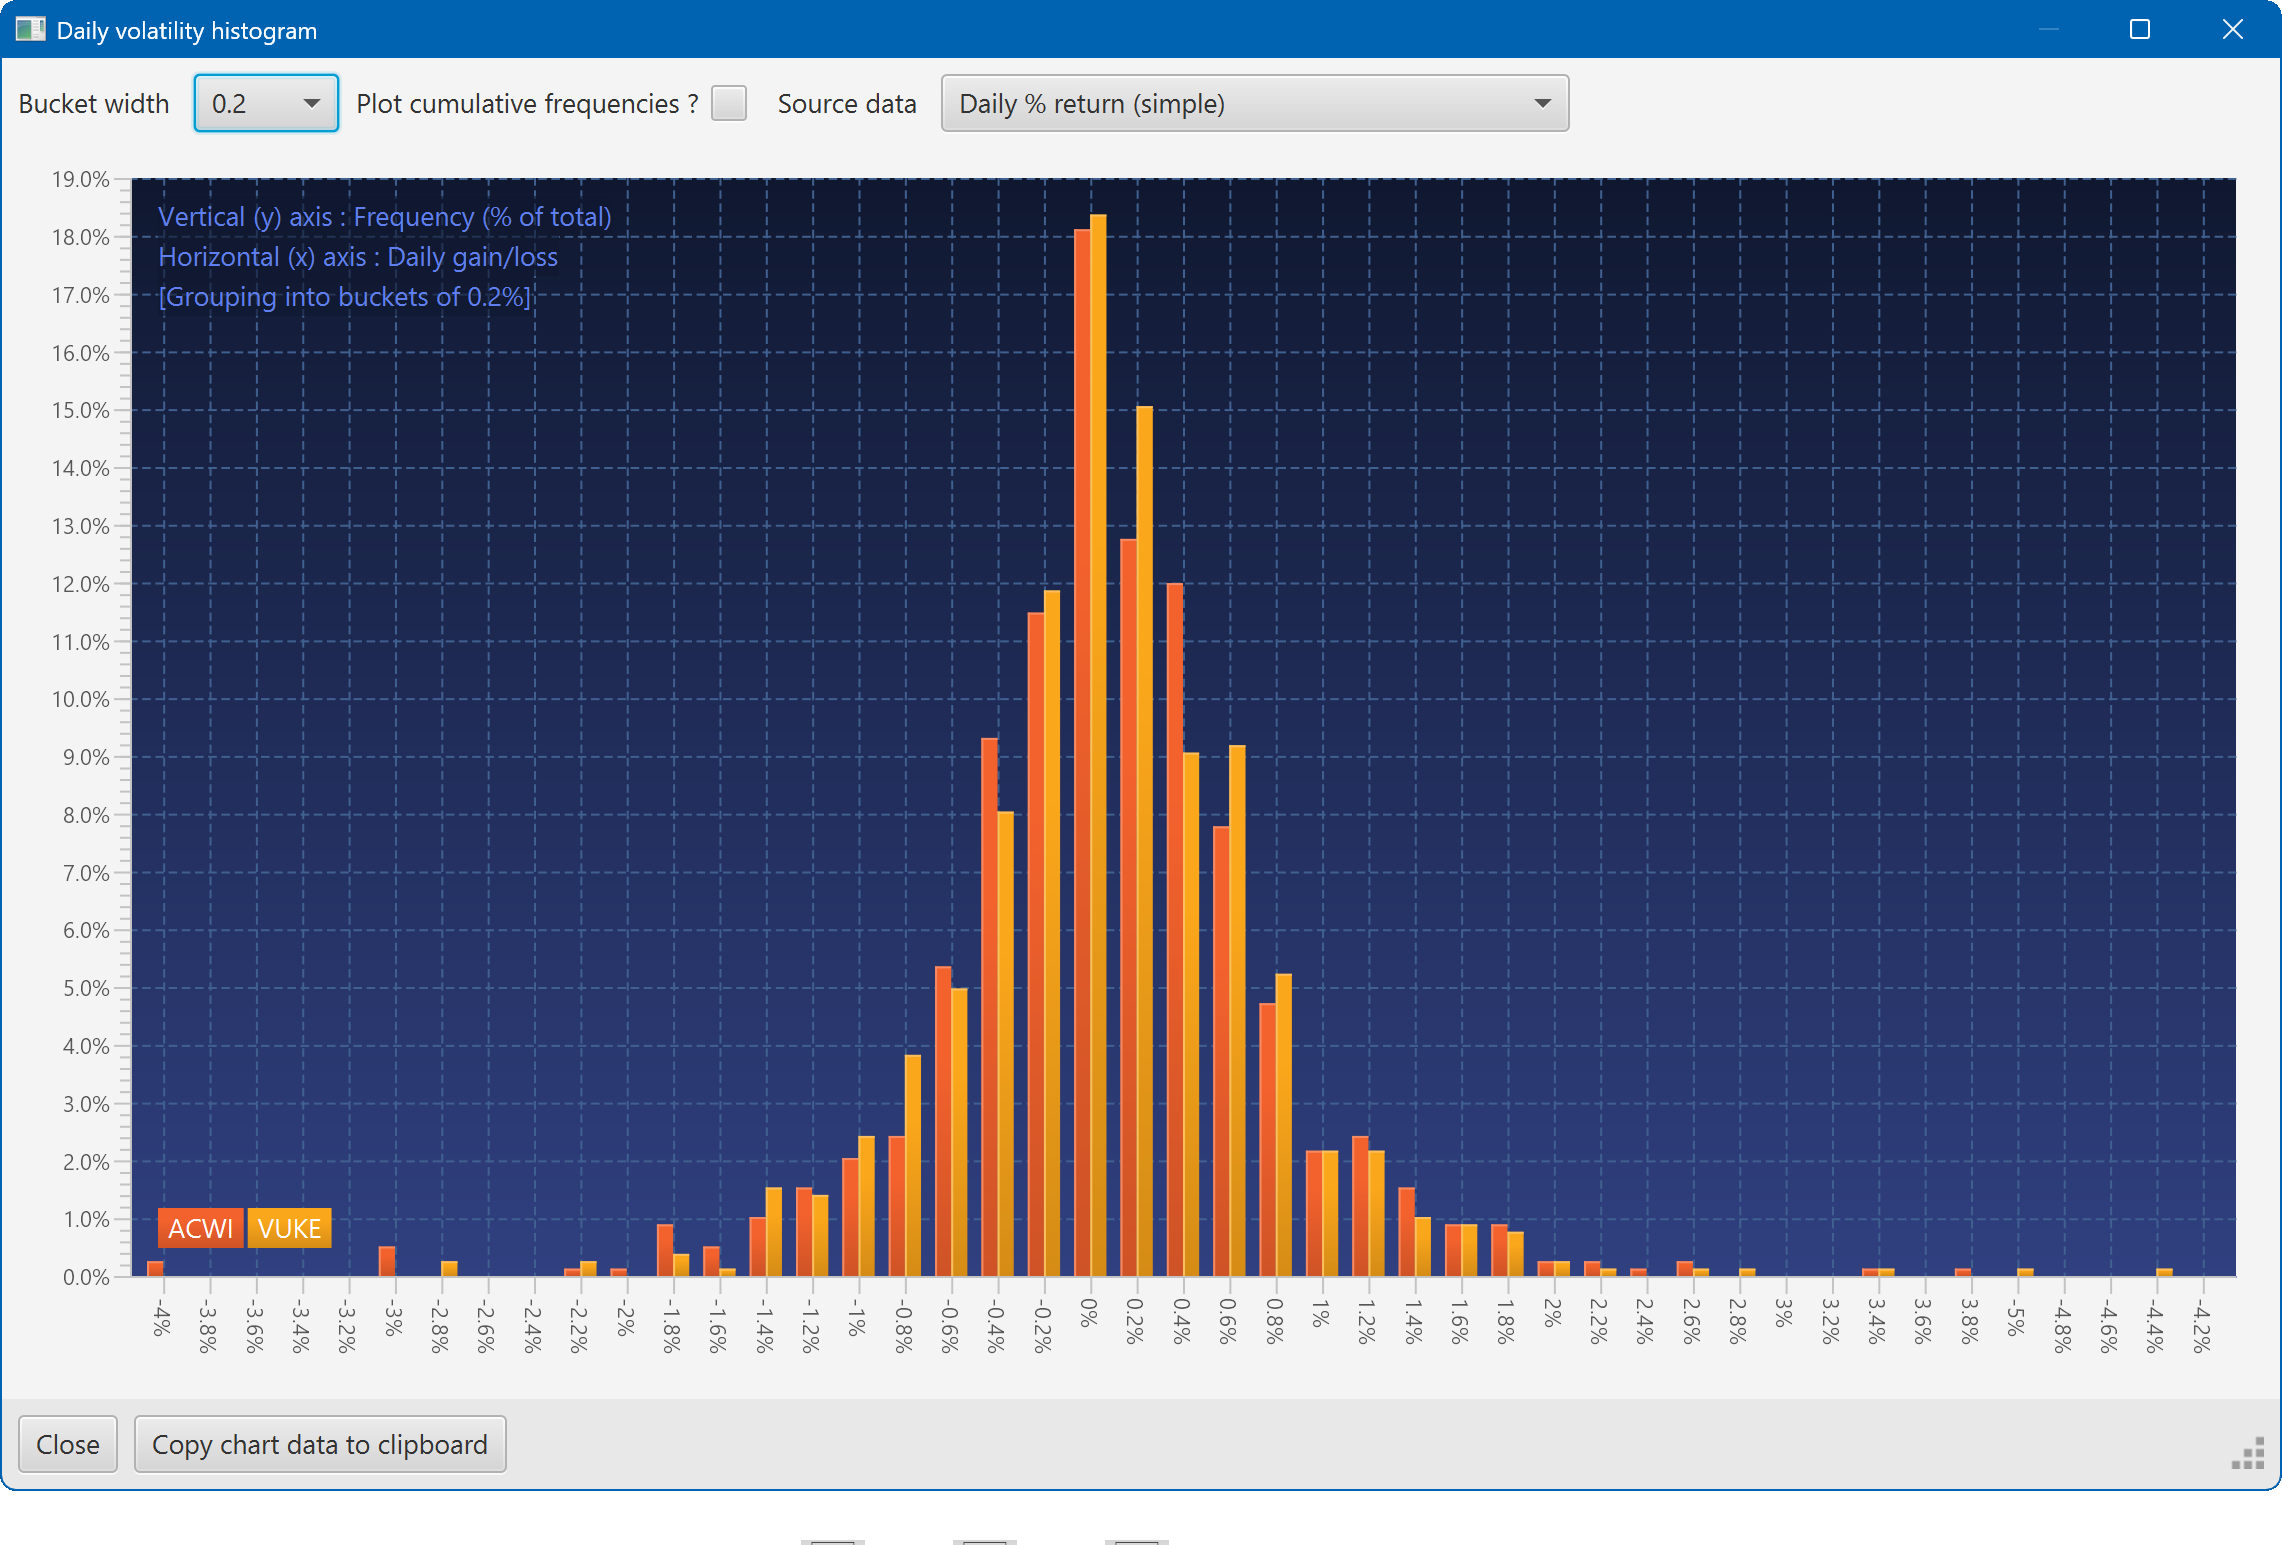
A histogram showing the daily returns of two securities, overlaid
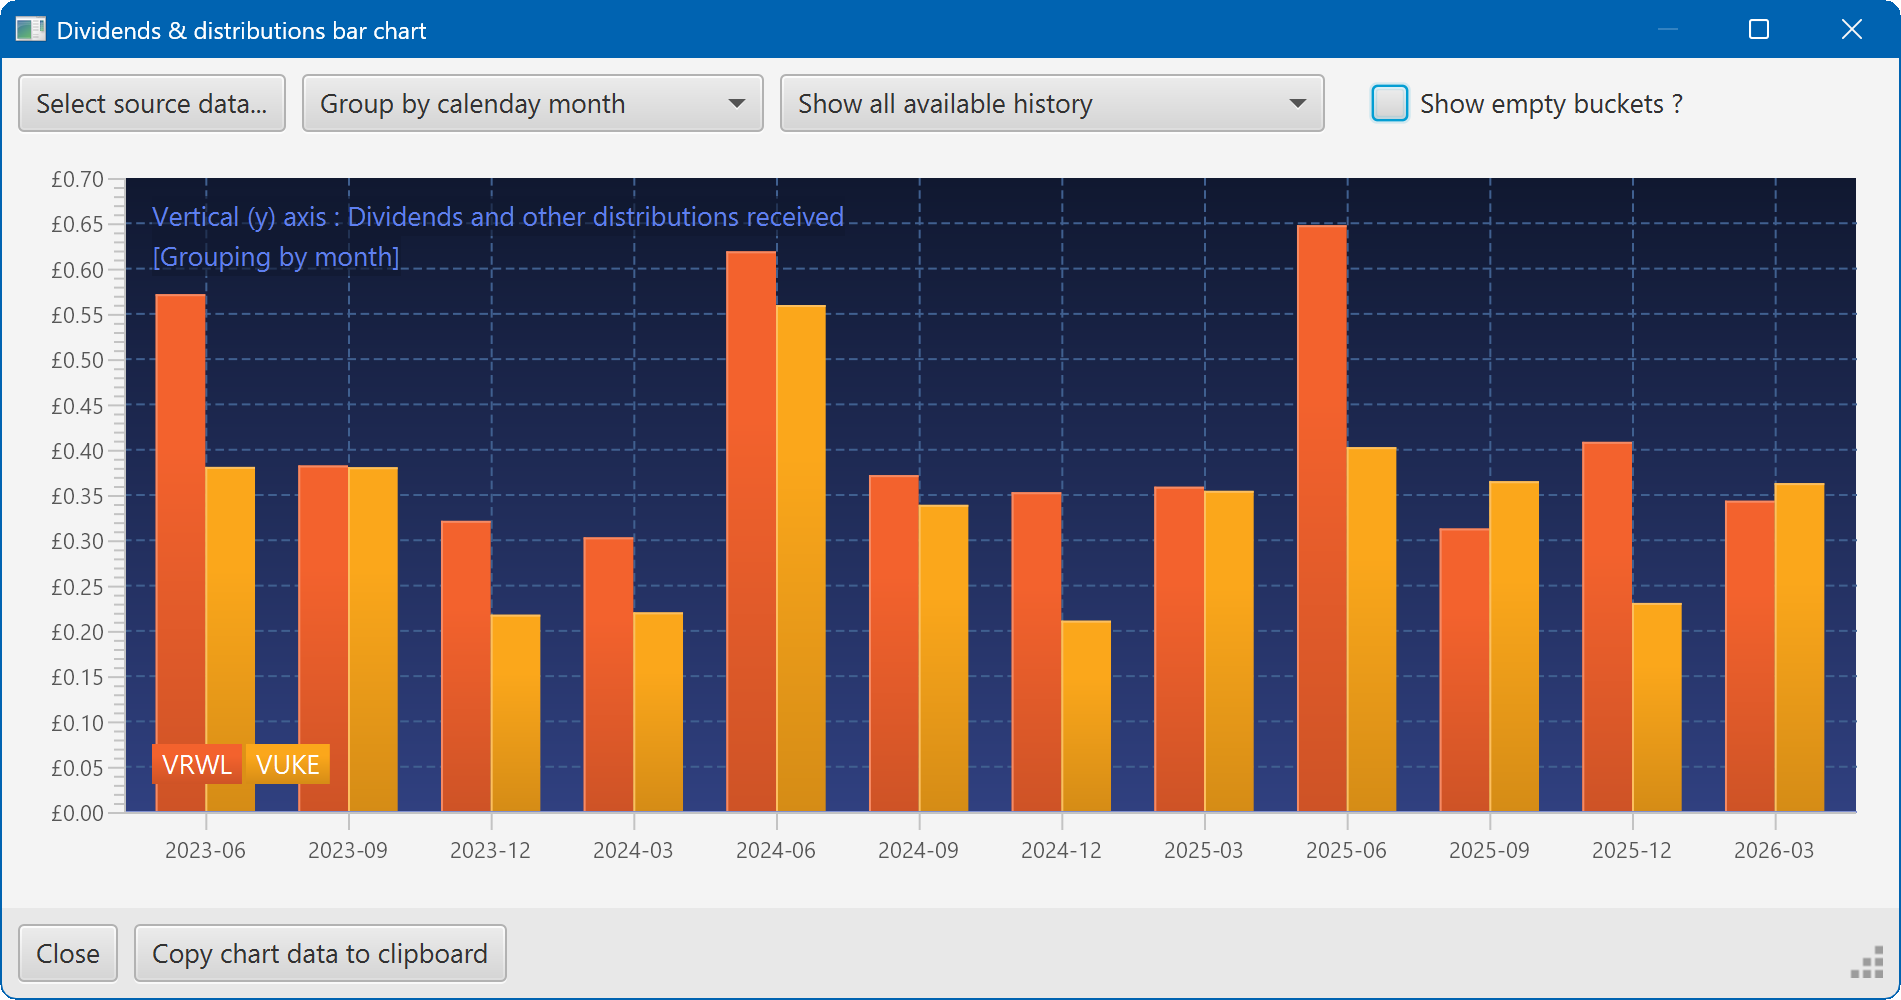
A bar chart showing the dividend history of two securities